Visualize SQL to ER diagram

Poom Wettayakorn
sql-patterns

SQL to ER Diagram
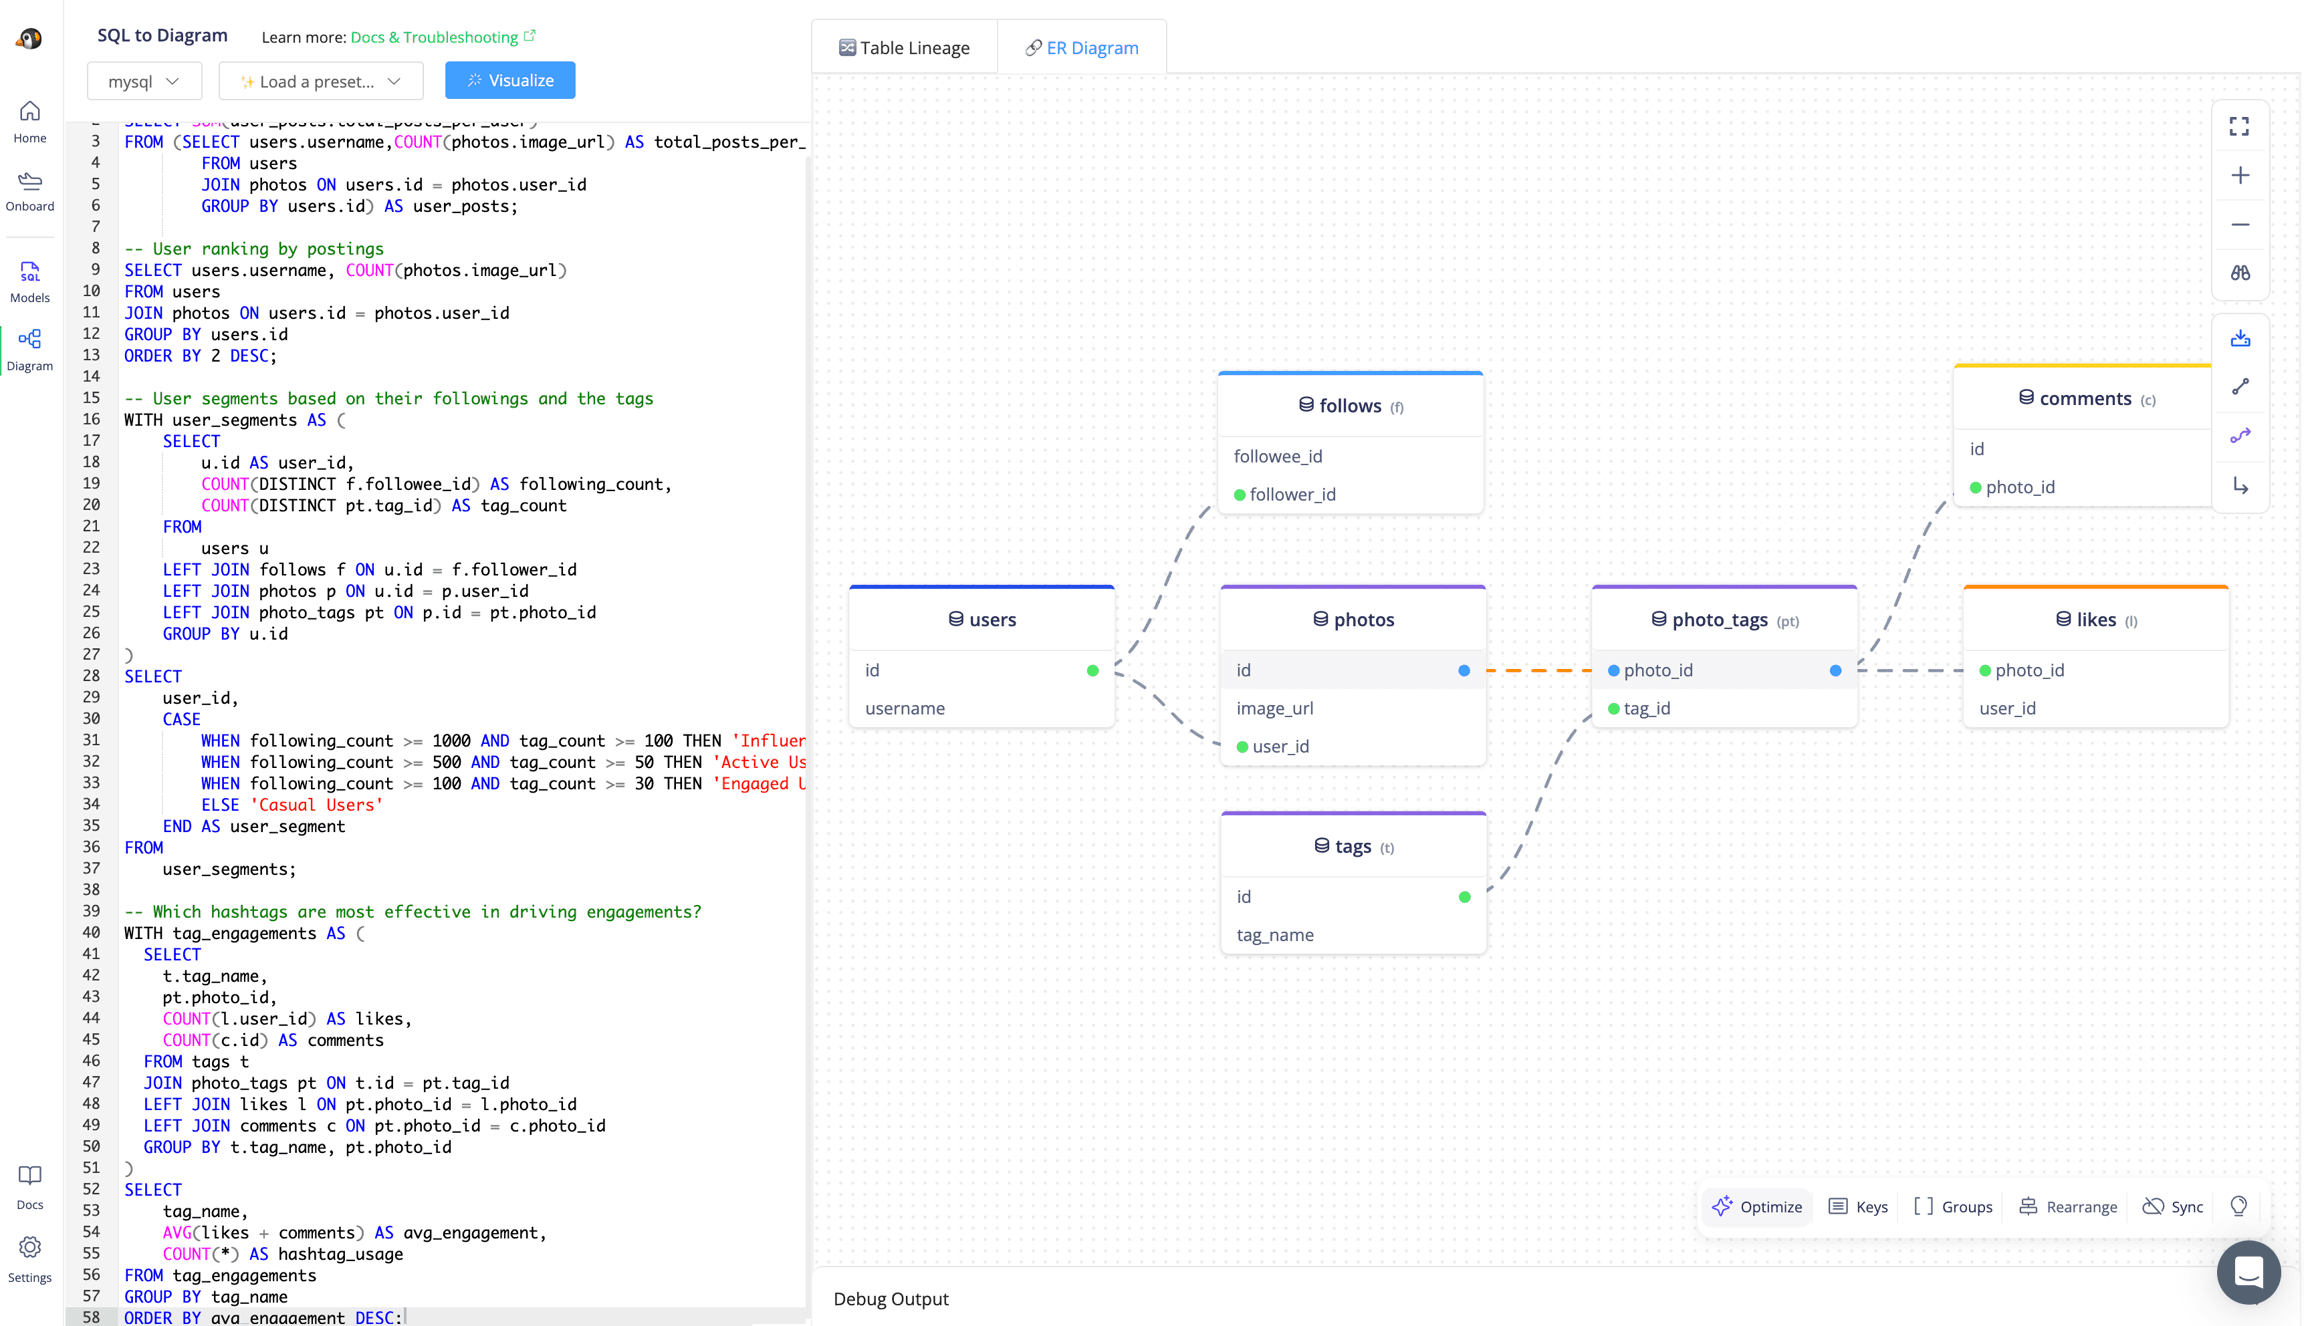
We present the way to draw your SQL queries as ER diagrams: a powerful tool for complex query understanding as well as creating database diagram from DDL/SQL!

Why is this useful?
Save time: No more manual diagramming! Generate accurate ER diagrams in seconds.
Understand someone else's code 😄: See join relationships clearly and easily.
Communicate your database schema: Share your ER diagrams with co-workers, ensuing everyone is on the same page.

How it works
We develop an algorithm to parse your SQL query and identify the tables, columns, and relationships involved. It then uses this information to automatically generate an ER diagram that is accurate and easy to understand.
See Datascale in action here
This tool is for anyone who speaks SQL! If you're dealing with lots of complex data and lacking of tools that can give you a full picture, this might be a solution for you. 🎉
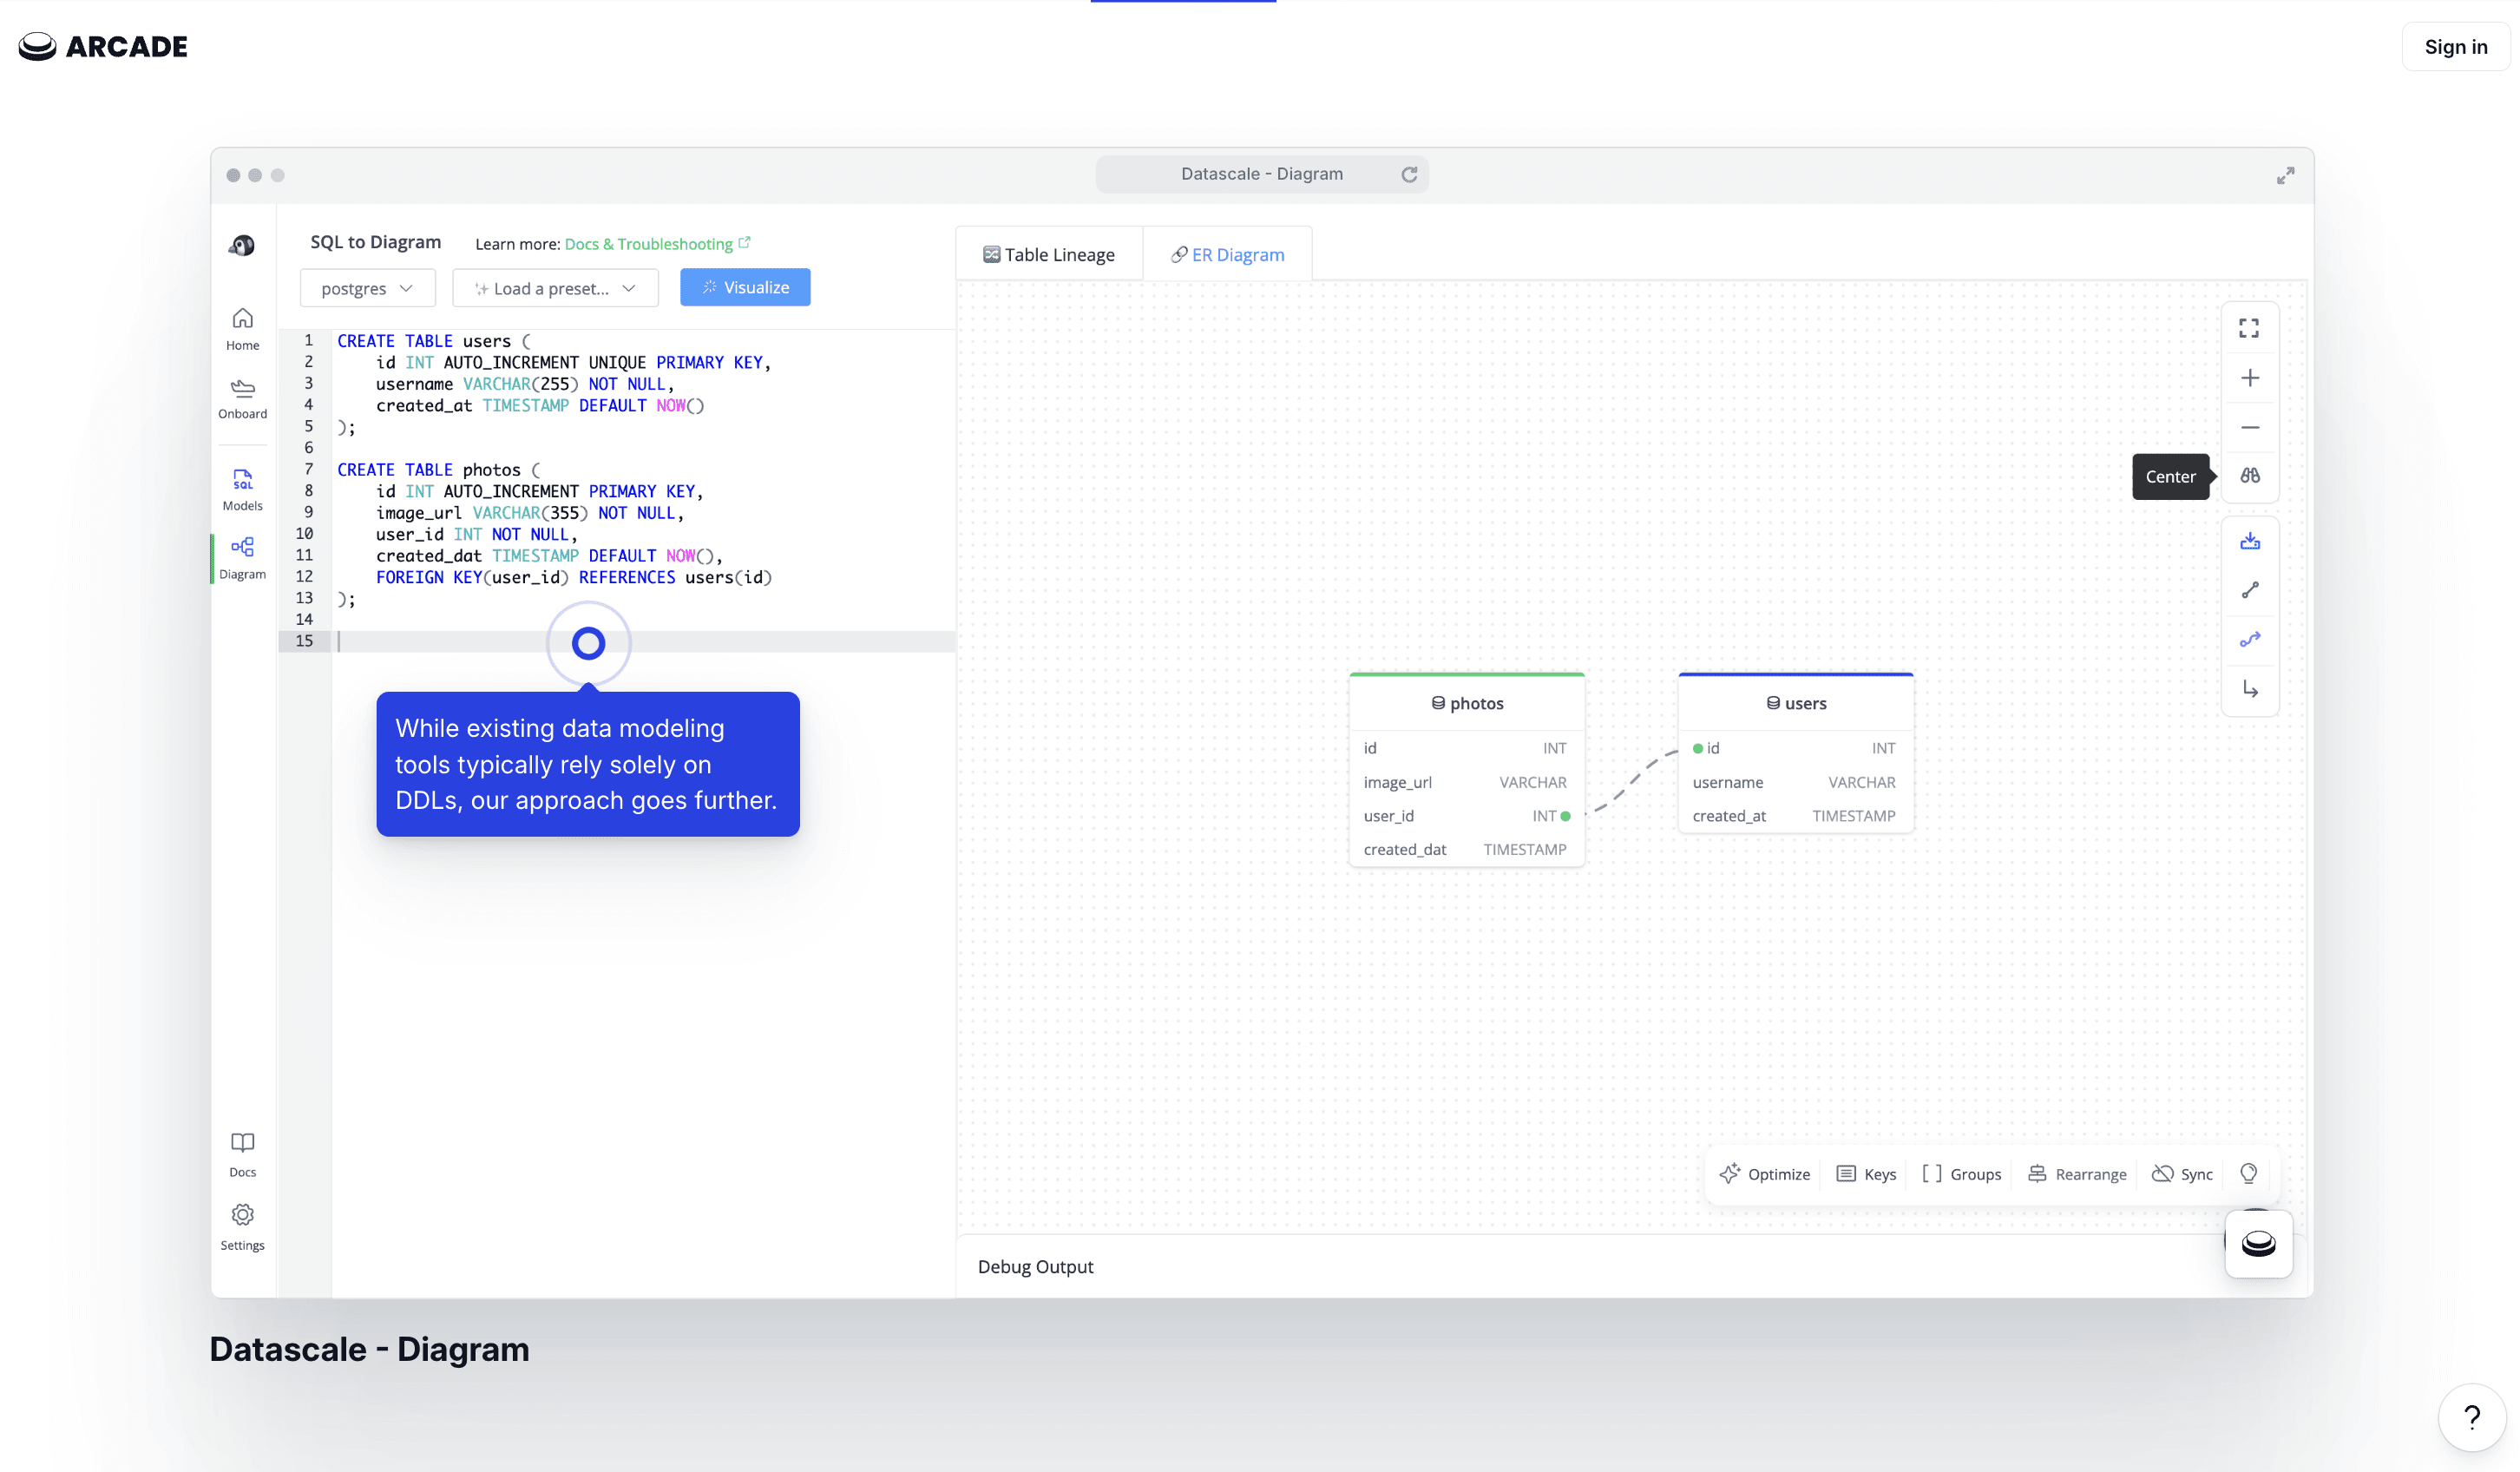
(While existing data modeling tools typically rely solely on DDLs, our approach goes further)
What's Next?
Love this quote from SeattleDataGuy here:
"You might have to deal with many-to-many relationships or have a complex transactional data model with non-standard naming conventions forcing you to join fields like employee_id to person_id (which you wouldn’t know if the Sr. Engineer hadn’t told you).", SeattleDataGuy
Typically, data models rely on DDLs to generate ER diagrams. But there's a catch: without primary keys and foreign keys, you’re left with an incomplete view.
By examining how tables are joined in SQL queries, we can infer relationships and automatically populate the foreign keys and primary keys in your data model.